I've started using graph-tool mainly because it's faster than networkx.
Recently I tried analyzing Wordnet by constructing a graph from all synsets
and polysemy relations between them; it has 117659 nodes and 549414 edges.
When I run statistics such as degree average, local clustering average and
pseudo diameter they only take a few seconds. On the other hand, if I try to
draw it with graph_draw it takes 6 hours (using 4 cores, and about 24hs of
combined CPU time) or graphviz_draw (which I haven't run for more than an
hour).
Initially I thought the bottleneck was in using labels (which I removed
afterwards), then in the layout algorithm (before confirming that random
layout takes only a few seconds), and finally outputting pixels instead of
vectors (svg instead of png), but none of them seemed to have to do with it.
Also, saving the graph also takes just a few seconds.
The time is certainly being spent on the layout code. Random layout is
always very fast, but it is not what is used internally by graph_draw(),
which uses instead sfdp_layout().
The graph you supplied has exactly 64835 connected components, one of
which is giant (~31% of the vertices), and the remaining are components
of very small size (mostly 1 or 2), composed mostly of single vertices
with self-loops. The multilevel layout algorithm in sfdp_layout() does
not handle this very well, since it does not collapse multiple
components together during the coarsening phase. I recommend simply
drawing the largest component, as such:
g = GraphView(g, vfilt=label_largest_component(g))
pos = sfdp_layout(g, verbose=True) # This way you get more information
# about the layout progress
graph_draw(g, pos=pos, output="output.png")
The result with ~70% of the network composed of single isolated vertices
would not look very informative, in any case.
When drawing large graphs, it is recommended to look closely at all the
options which can be given to sfdp_layout(), since they can often
dramatically change the speed and the quality of the result (although
the default behavior should be good enough in most cases).
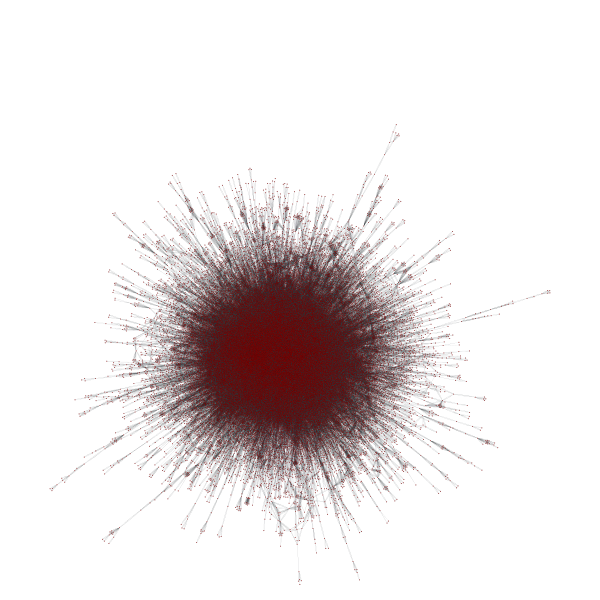
BTW, this took only a couple of minutes on my laptop. The result is
attached. Unfortunately, the result is pretty much a ridiculogram[1], as
is often the case for large networks, which are not tree-like.
Thank you very much, now I can draw it in 5 minutes.
As you pointed out, there are many vertices with self-loops. This was my
mistake in the algorithm for the transitive closure; the result should be
the biggest component you filtered.
I thought that graph_draw() used sfdp_layout() in case "pos" wasn't supplied
(i.e. None), so I used:
pos = gt.random_layout(polysemy)
gt.graph_draw(polysemy, pos=pos, output_size=(10000,10000),
output='ejercicio_5_rnd.png')
Expecting it would take less time.
Maybe this paragraph in the documentation should be changed:
"Vector-valued vertex property map containing the x and y coordinates of the
vertices. If not given, it will be computed using sfdp_layout()."
In particular, my idea was to reduce node size and color edges according to
different criteria. This is explained in the documentation, so I can check
it by myself.
Also I would like to see nodes expanded through the canvas, because they are
densely packed into a corner. What is the option for controlling this?
I thought that graph_draw() used sfdp_layout() in case "pos" wasn't supplied
(i.e. None), so I used:
pos = gt.random_layout(polysemy)
gt.graph_draw(polysemy, pos=pos, output_size=(10000,10000),
output='ejercicio_5_rnd.png')
Expecting it would take less time.
It should!
Maybe this paragraph in the documentation should be changed:
"Vector-valued vertex property map containing the x and y coordinates of the
vertices. If not given, it will be computed using sfdp_layout()."
But this is correct. Does it really take five hours if you supply pos =
random_layout() ?!
Also I would like to see nodes expanded through the canvas, because they are
densely packed into a corner. What is the option for controlling this?
The bounding box is calculated automatically if fit_view=True. If you
set it False, the positions will be considered to correspond to the
output format units (pixels in case of png, points in case of pdf, etc).
If you are getting strange-looking results with fit_view=True, then
please send me an example.
But this is correct. Does it really take five hours if you supply pos =
random_layout() ?!
The one that took 6 hours was without supplying "pos". When I supplied a
random one, it took more than 2 hours and I stopped it.
Strangely, unlike the former it uses only one CPU. I believe graph_draw
is taking too long, because random_layout finishes almost immediatly.
When using your code to filter the largest component it takes 5 minutes,
most of the time processing the layout (as shown with the verbose option
you suggested).
But graph_draw is not wasting time calculating the graph layout when
supplied random positions, I don't know what it could be doing.
Does it also happen to you:
pos = gt.random_layout(polysemy)
print "here"
gt.graph_draw(polysemy, pos=pos, output='ejercicio_5_gv.png')
> Also I would like to see nodes expanded through the canvas, because
they are
> densely packed into a corner. What is the option for controlling this?
The bounding box is calculated automatically if fit_view=True. If you
set it False, the positions will be considered to correspond to the
output format units (pixels in case of png, points in case of pdf, etc).
If you are getting strange-looking results with fit_view=True, then
please send me an example.
I've attached a screenshot, which shows unused space in the image.
I would like to separate nodes as much as possible so that edges are
visible, or strech them to fit the picture at least.
But this is correct. Does it really take five hours if you supply pos =
random_layout() ?!
The one that took 6 hours was without supplying "pos". When I supplied a
random one, it took more than 2 hours and I stopped it.
Strangely, unlike the former it uses only one CPU. I believe graph_draw
is taking too long, because random_layout finishes almost immediatly.
When using your code to filter the largest component it takes 5 minutes,
most of the time processing the layout (as shown with the verbose option
you suggested).
But graph_draw is not wasting time calculating the graph layout when
supplied random positions, I don't know what it could be doing.
Does it also happen to you:
pos = gt.random_layout(polysemy)
print "here"
gt.graph_draw(polysemy, pos=pos, output='ejercicio_5_gv.png')
This took only about 2 seconds on my machine... I have no idea how it
could take two hours.
I've attached a screenshot, which shows unused space in the image.
I would like to separate nodes as much as possible so that edges are
visible, or strech them to fit the picture at least.
There is obviously something wrong with the bounding box
calculation. I'll take a look into it.
> Does it also happen to you:
> pos = gt.random_layout(polysemy)
> print "here"
> gt.graph_draw(polysemy, pos=pos, output='ejercicio_5_gv.png')
This took only about 2 seconds on my machine... I have no idea how it
could take two hours.
I made a mistake. My program was also using "output_size=(10000,
10000)". With the default value it takes a few seconds.
But is it supposed to take so much when increasing output size? The most
expensive part should be calculating node positions, as you said.
> I've attached a screenshot, which shows unused space in the image.
>
> I would like to separate nodes as much as possible so that edges are
> visible, or strech them to fit the picture at least.
There is obviously something wrong with the bounding box
calculation. I'll take a look into it.
If you use the PNG format it has to construct a huge 10000x10000 matrix,
and paint he pixels inside the vertices, edges, etc. Everything should
scale roughly with the area of the figure.
This does not happen of course with vector formats, such as SVG and PDF,
where the size of the figure is just a number.