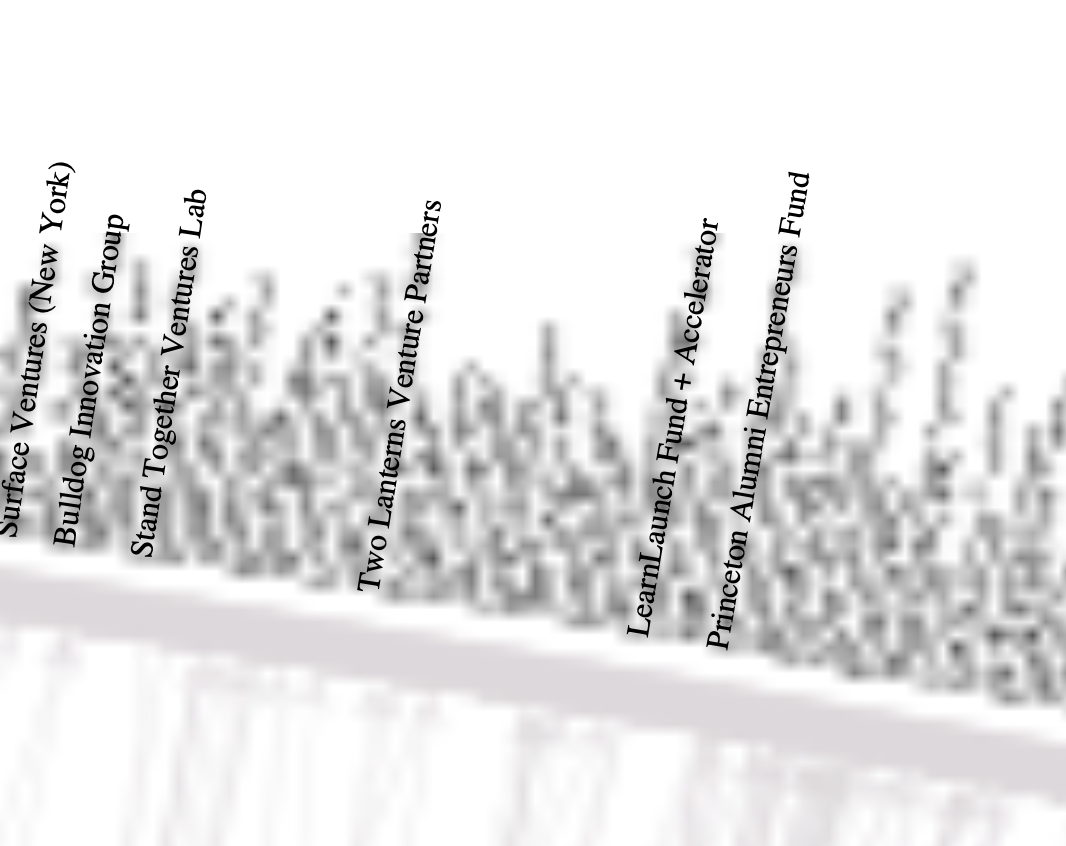
I’m working with quite a large network (600k edges, 10k nodes) that I am visualizing using the draw_hierarchy() function below. I want to add node labels, but when I do that, something strange happens: some of the labels are blurry, while others are readable. Has anyone else encountered this?
This happens even if I plot in PDF (or SVG) and even if I specify very high output_size. I’ve created files with output_size of 10,000x10,000 and produced gigabyte-large figures, but still the labels are blurred. It seems that some labels get down-sampled to bitmap format with low resolution and are not printed as vector graphic as intended. Does anyone know how to fix this and/or how to increase the minimum resolution for the down-sampling? I would be okay with the downsampling to bitmap as long as I can increase the resolution to make the labels readable.
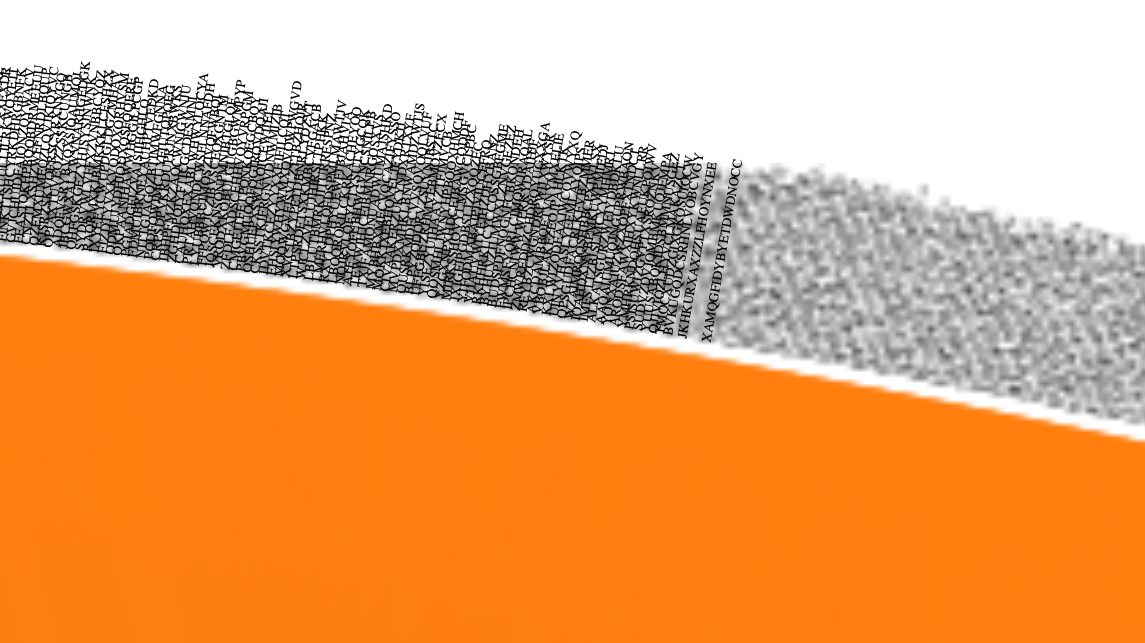
The down-sampling seems to happen for other elements of the plot too: see how the arrows and lines pointing to the nodes are blurred too? Note: this is a screenshot of a 1GB PDF.
Unfortunately, it’s not possible to provide a solution to your problem or an answer to your question with the information provided.
To enable us to understand the situation, you need to provide all the items below:
Your exact graph-tool version.
Your operating system.
A minimal working example that shows the problem.
Item 3 above is very important! If you provide us only the part of the code that you believe causes the problem, then it is not possible to understand the context that may have contributed to it.
You need to provide us with a complete example that runs and reproduces the problem you are observing.
See minimal code example below. The sample graph can be downloaded here.
import random
import math
from graph_tool.all import *
from numpy import sqrt
import numpy as np
import matplotlib as matplotlib
import matplotlib.pyplot as plt
import pandas as pd
from graph_tool.draw import libgraph_tool_draw as libgt_draw

# Load graph
# https://www.dropbox.com/scl/fi/i0kca8autmexsnxxok555/Sample-Graph.gml?rlkey=v6g848ifv8cw7ixt7phgfnviw&dl=0
g = load_graph("~/Download/Sample-Graph.gml")
g

# Fit block model
seed_rng(1)
state_dg = minimize_nested_blockmodel_dl(g)
state = state_dg
state

# Plot
state.draw(
           vertex_text=g.vp.Label,
           vertex_text_position="centered",
           edge_pen_width=0.8,
           output_size=(600,600),
           output="graph.pdf")
Thanks Tiago. This kinda works but as you warned: the files are huge and it’s difficult to even open them in a PDF viewer.
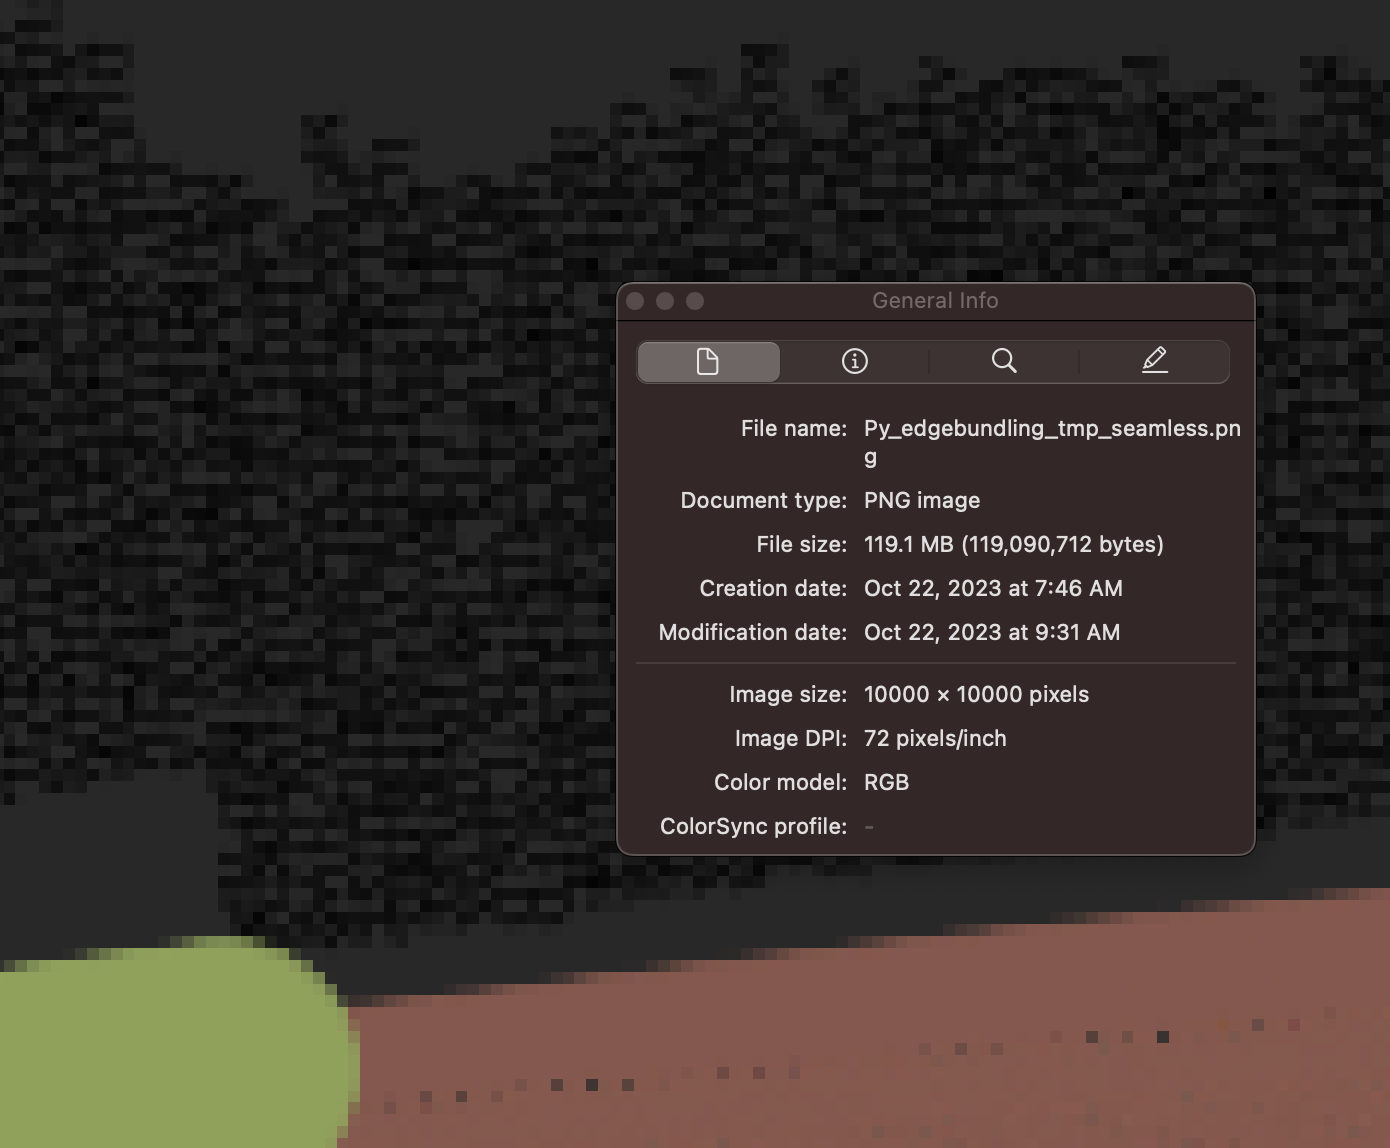
Do you know if it’s possible to change the resolution when doing it as png? When I create a version as png with 10,000 x 10,000 pixels, the resolution is still 72 dpi and the labels are not readable. Is there some way to pass an argument to cairo that changes the resolution?
Cairo does not have a concept of DPI — you can only set the size of the image.
You should play with the font size, but in my experience the best way to get high-resolution PNGs is to generate first a PDF and then convert to PNG using pdftocairo.