I’ve time points of a dynamic graph, each step saved as an .xml file, and i want to create an animation from these however I couldn’t find a way to do that from the tutorials. Is there any way to do that on graph-tool?
There’s an animation HOWTO here: Animations with graph-tool — graph-tool 2.84 documentation
Hi, thank you for your answer.
I’m trying to use that first part but I think I’m doing it wrong. I’m getting this AttributeError “DiGraph object has no attribute num_vertices”, so should I convert DiGraph to something else?
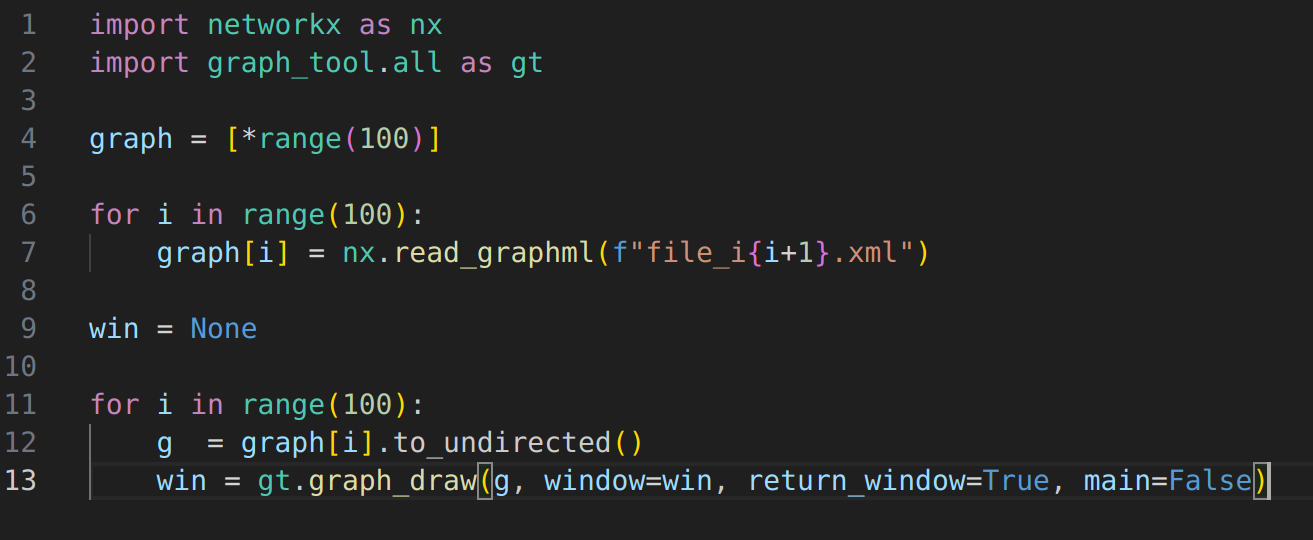
This is the presumably very wrong code I’m trying to work with:
Networkx and graph-tool are completely different libraries. If you have a question about networkx, please go to their forum. This is not the right place.
Okay, so I found load_graph function and I used that to import the graphs, again, on graph_draw it’s giving me another error saying GraphWindow has no attribute graph so is the import wrong? Other that does the code look ok?
Unfortunately, it’s not possible to provide a solution to your problem or an answer to your question with the information provided.
To enable us to understand the situation, you need to provide all the items below:
- Your exact graph-tool version.
- Your operating system.
- A minimal working example (MWE) that shows the problem. The MWE needs to be
a. Self-contained. I.e. it cannot depend on any other context or resource. If it depends on files, they need to be provided.
b. Minimal. I.e. it needs to include only what is necessary to reproduce the problem.
Item 3 above is very important! If you provide us only with a vague description, or only with the part of the code that you believe causes the problem, then it is not possible to understand the context that may have contributed to it.
You need to provide us with a complete example that runs and reproduces the problem you are observing.
Hello again,
My graph-tool version is 2.84, operating system is Ubuntu 24.04.1.
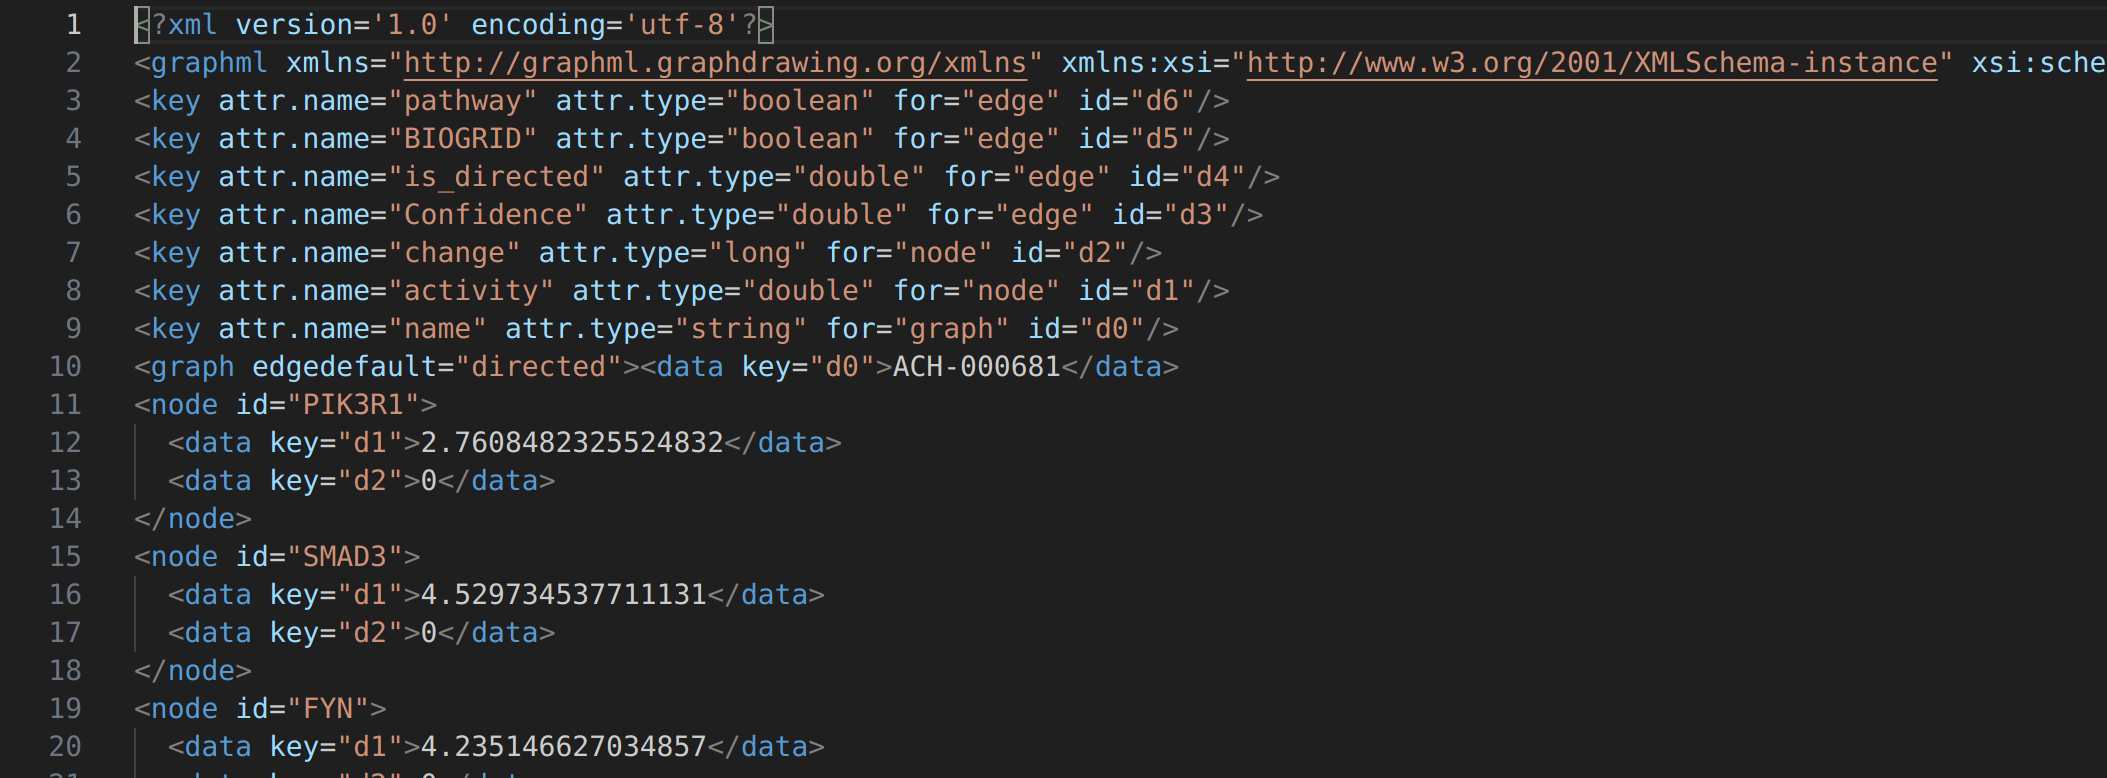
This is how one my .xml files look like (there are 100 of them, all timesteps):
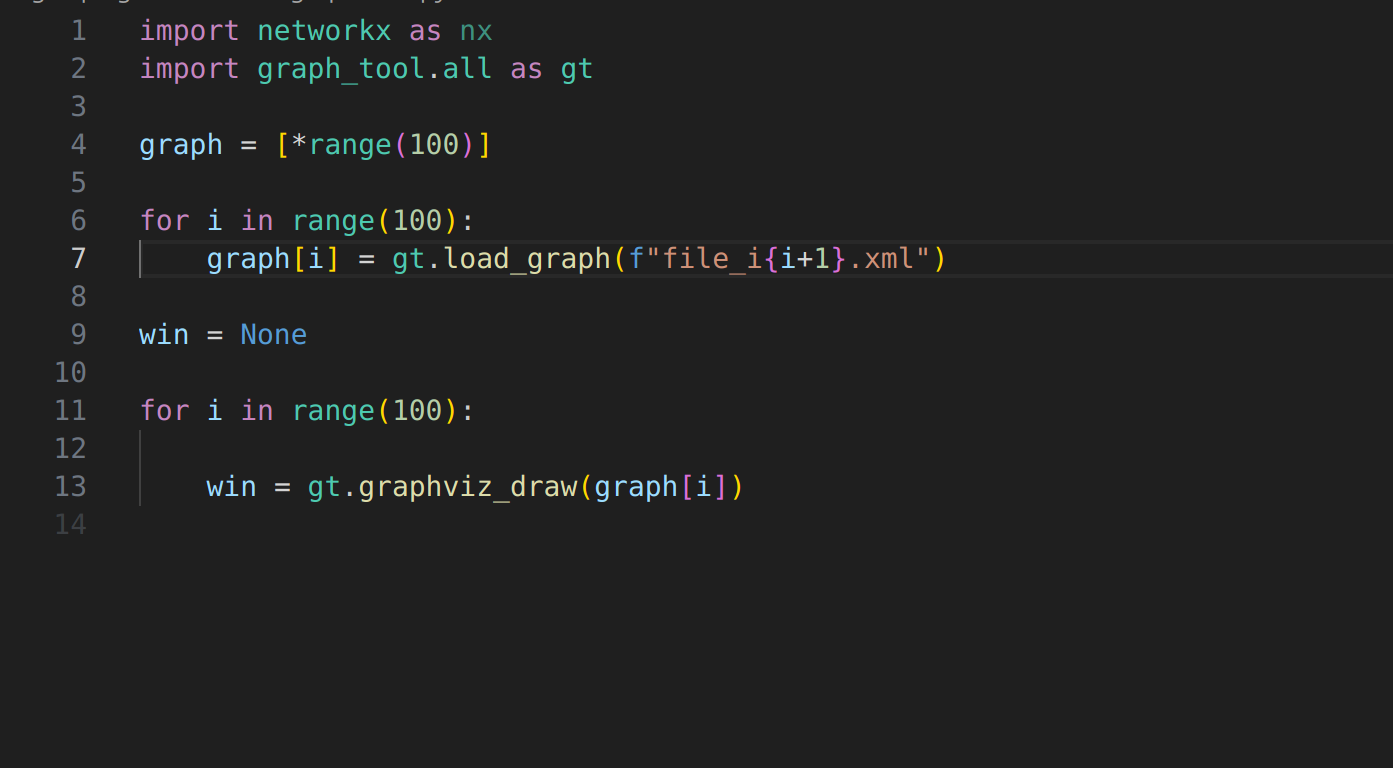
and this is the final version of the code:
That is the output that I get:
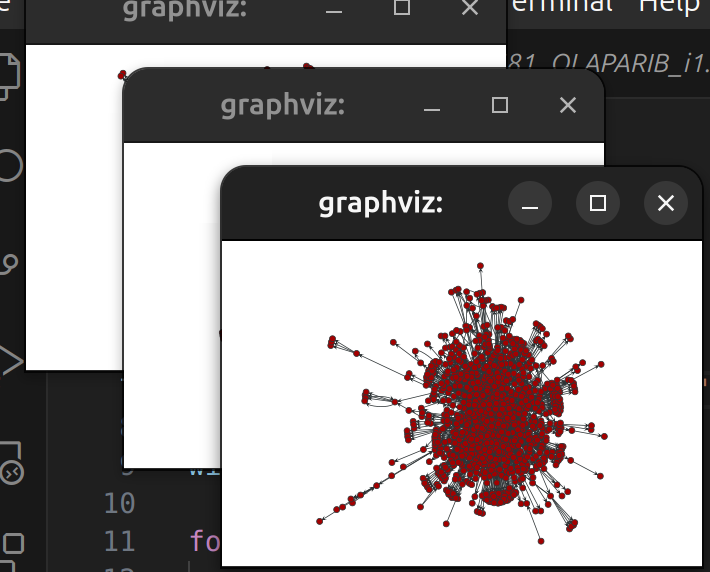
but I want there to be only one window with animation showing new nodes/edges appearing and disappearing. I don’t know if this is clear enough but I hope I’ve managed to describe my problem a bit.
Thank you
To post code, please use triple back-ticks for proper formatting:
for x in range(100):
    print("hello world")
or upload your files as attachments. NEVER post screenshots of the code. Do you expect someone else to type them?
As for your question, as I already explained, there’s an example of how to achieve what you want in the documentation: Animations with graph-tool — graph-tool 2.85 documentation
Just look at the very first example.
Yes, thank you for your answers and sorry for causing trouble. In the example it uses a gt.collection file and I couldn’t find a way to replicate what it did with an array of graphs instead. However again, thank you for your help.
import networkx as nx
import graph_tool.all as gt

graph = [*range(100)]

for i in range(100):
     graph[i] = gt.load_graph(f"file_i{i+1}.xml")
win = None

for i in range(100):
     win = gt.graph_draw(graph[i], window = win, return_window=True, main=False)
Example .xml file:
file_i1.xml (753.1 KB)
Does this work?