Hi Prof. Peixoto,
gt version: 2.98
os: ubuntu22
python: 3.13
Question:
can we change the default colors list to a user specified one while drawing a BlockState() for instance?
MWE:
import numpy as np
from scipy import sparse
import graph_tool.all as gt

adj = np.array([
    [0, 0, 0, 1, 0, 0, 0, 0, 0, 0, 0],
    [0, 0, 1, 1, 0, 0, 0, 1, 0, 0, 0],
    [0, 0, 0, 1, 0, 0, 1, 1, 0, 0, 0],
    [0, 0, 0, 0, 1, 1, 0, 0, 0, 0, 0],
    [0, 0, 0, 0, 0, 0, 0, 0, 0, 0, 0],
    [0, 0, 0, 0, 0, 0, 0, 0, 0, 0, 0],
    [0, 0, 0, 0, 0, 0, 0, 1, 8, 9, 1],
    [0, 0, 0, 0, 0, 0, 0, 0, 0, 0, 0],
    [0, 0, 0, 0, 0, 0, 0, 0, 0, 0, 0],
    [0, 0, 0, 0, 0, 0, 0, 0, 0, 0, 0],
    [0, 0, 0, 0, 0, 0, 0, 0, 0, 0, 0],
])
adj = adj + adj.T
g = gt.Graph(sparse.lil_matrix(adj), directed=False)
b = np.array([1, 2, 2, 2, 1, 1, 2, 2, 1, 1, 1])
state = gt.BlockState(g, b)
state.draw()
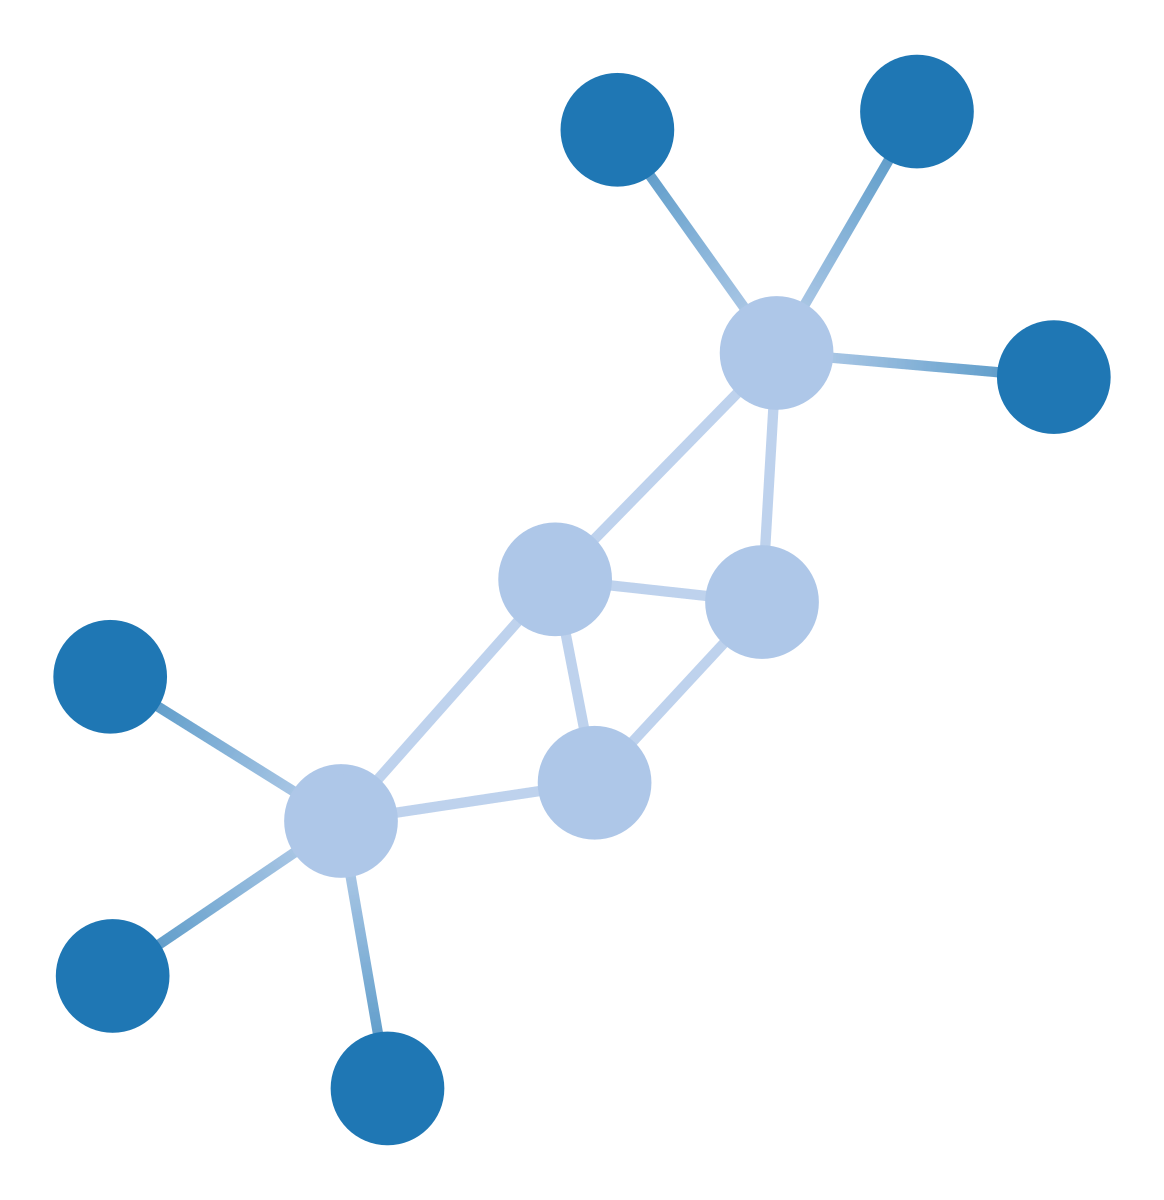
Attached is the output of the MWE.
Instead of having blue and light blue colors, can I specify some other colors while drawing?
Many thanks,
Govinda