Hello.
import sys, os
from pylab import *
from numpy.random import *
from graph_tool.all import *
g = Graph(directed=False);
N = 10;
v = g.add_vertex();
vlist = [v];
for i in range(1, N):
v = g.add_vertex()
c = randint(0, len(vlist))
target = vlist[c]
g.add_edge(v, target)
vlist.append(v)
if randint(0, 2) == 1:
rem = randint(0, len(vlist))
g.remove_vertex( vlist[rem] );
graph_tool.stats.remove_self_loops(g);
pos = sfdp_layout(g, cooling_step=0.99);
graph_draw(g, pos, output_size=(1000, 1000),vertex_size=10,
edge_pen_width=2.2, output="graph" + str(i) + ".png")
l = graph_tool.topology.label_largest_component(g);
print(l.a);
u = graph_tool.topology.GraphView(g, vfilt=l);
print(u.num_vertices());
=============out=======
python test_graph.py
[0 1 1 0 0]
2
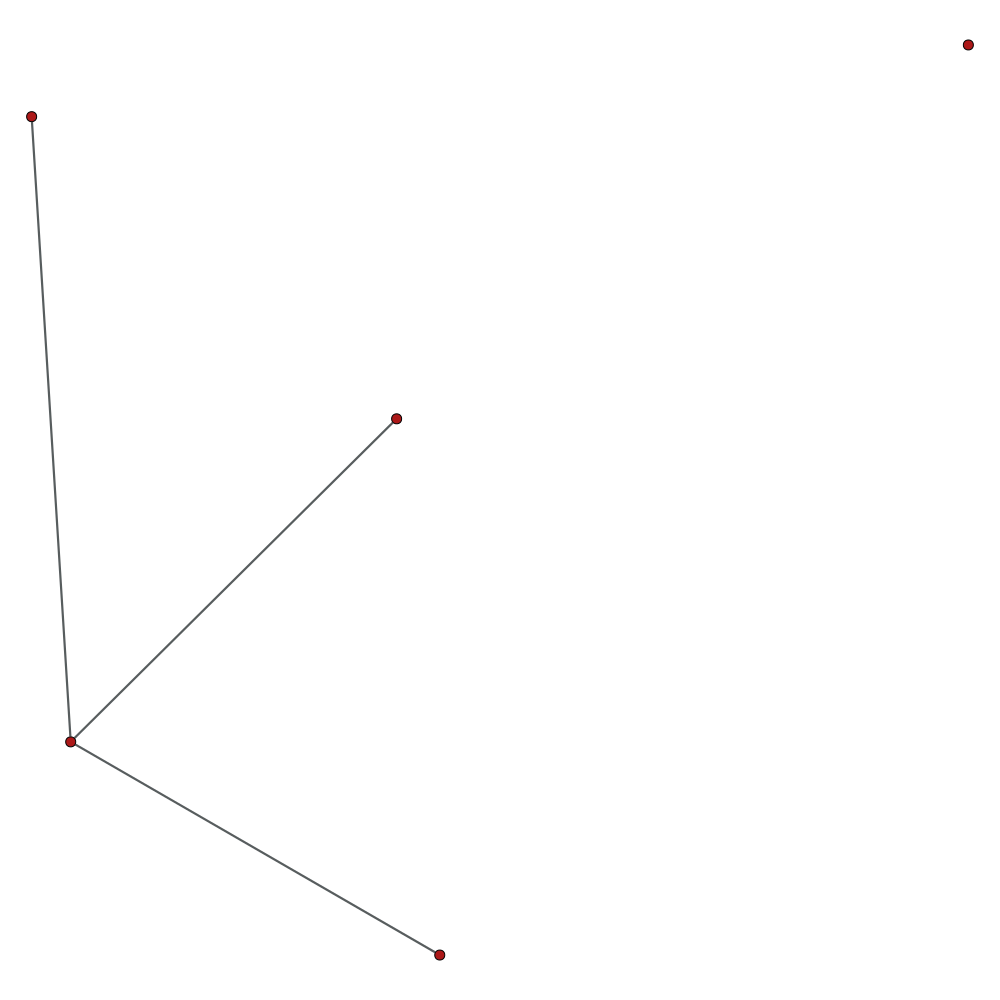
but in image i see 4 vertex in largest connected component.
I try it over and over, and always see that 1 or 2 vertex missed.
attachment.html (1.23 KB)