Hi,
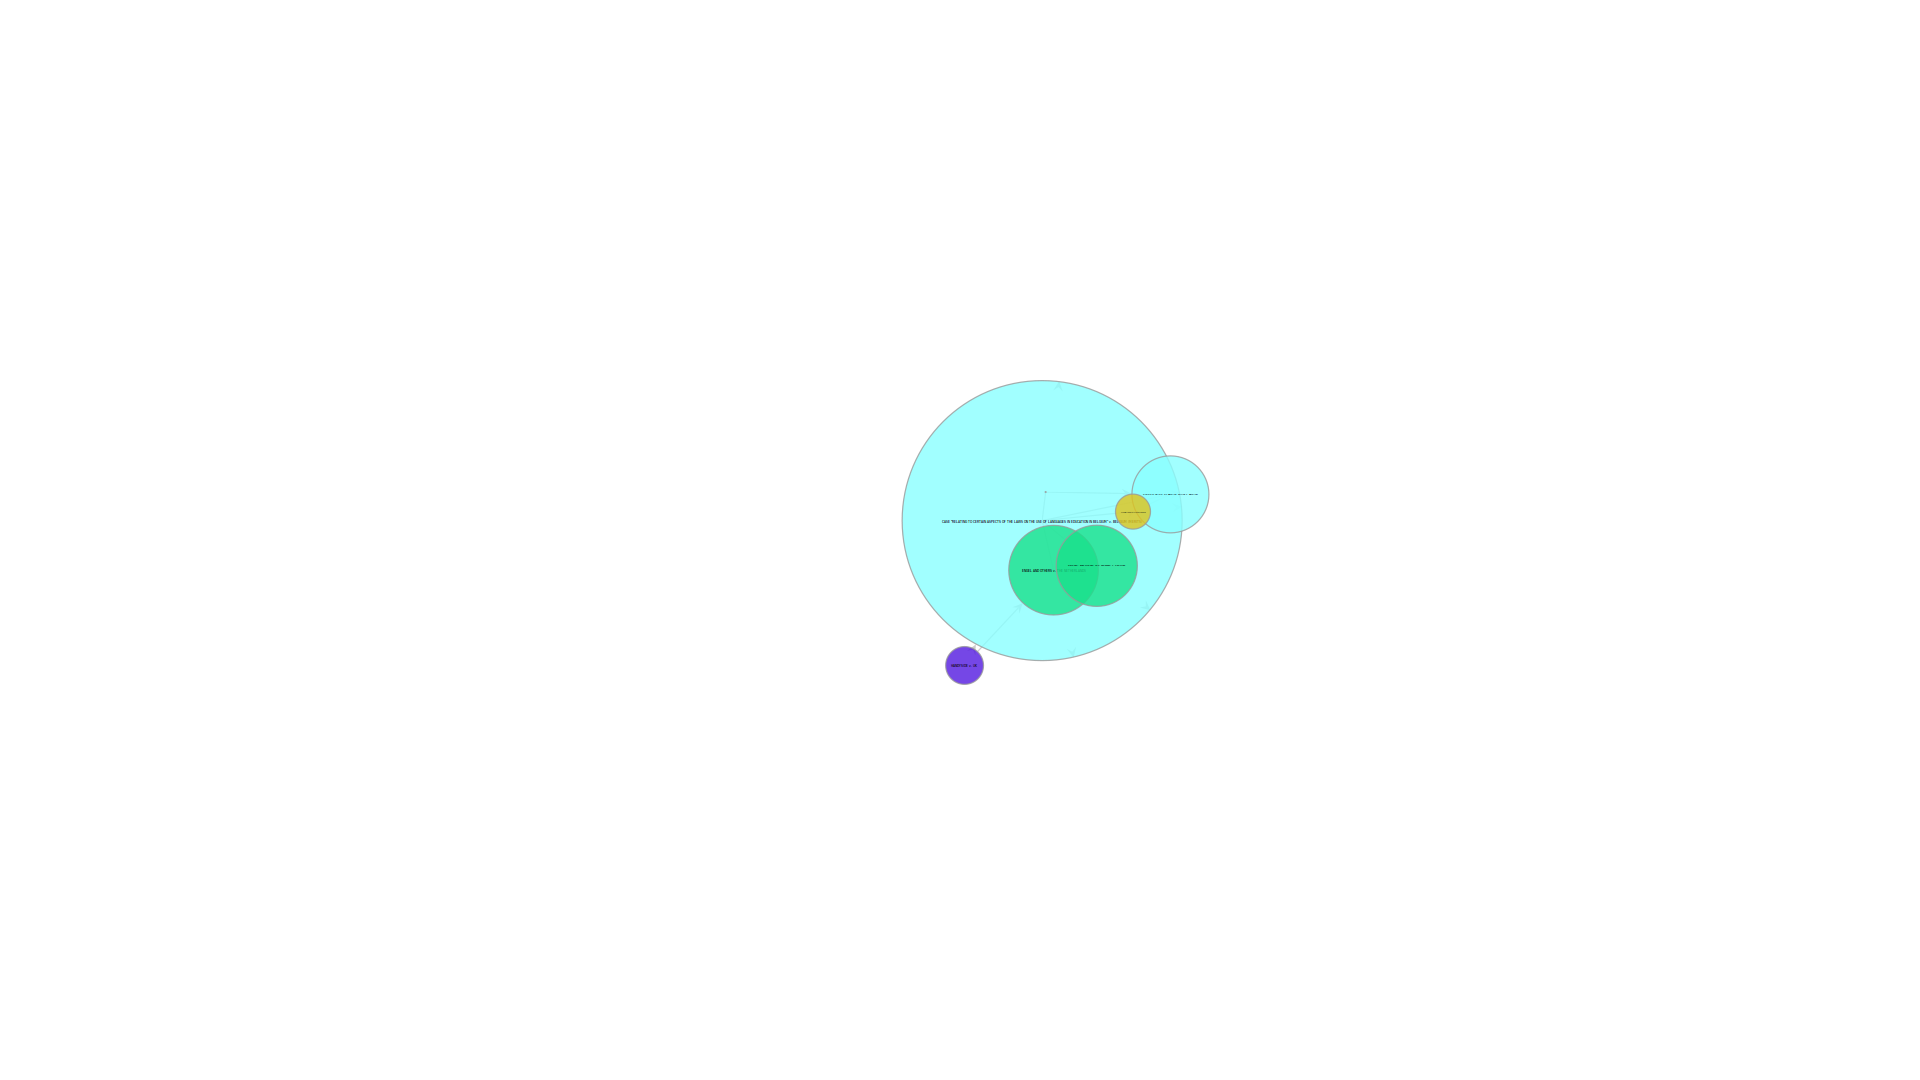
I apologise for the long post. I am trying to draw an evolving graph and create some snapshots every year. I want to show the growth of the graph by increasing the size of the nodes and the size of the node labels. In the beginning because my node labels were long, drawing the graph caused the nodes to fully enclose the label (example attached), despite any effort to control their size programmatically, making the graph unreadable.
Then I discovered the (undocumented?) parameter "vertex_text_position" and started setting it to e.g. 4. Now whenever the nodes grow in size, as the time goes by, the labels are being displaced far away from the corresponding nodes.
Three questions:
1. What are the possible values for "vertex_text_position" and what is their meaning
2. Why are the labels being displaced when node grows in size instead of staying next to the node and
3. Is it possible to align the label at center of the node and at the same time ensure the node size is not adjusted to cover the entire label?
My code looks approximately like that:
pos = g.new_vertex_property("vector<double>")
col = g.new_vertex_property("vector<double>")
vf_size = g.new_vertex_property("float")
for v in g.vertices():
pos[g.vertex(v)] = [float(g.vp['x'][v]), float(g.vp['y'][v])] # load layout from the existing file
col[g.vertex(v)] = [int(g.vp['r'][v])/255.0, int(g.vp['g'][v])/255.0, int(g.vp['b'][v])/255.0, 0.8]
if not offscreen:
win = GraphWindow(g, pos=pos,
geometry=(1024, 768),
edge_color=[0.6, 0.6, 0.6, 1],
vertex_fill_color=col,
)
else:
win.graph = GraphWidget(g, pos=pos,
edge_color=[0.8, 0.8, 0.8, 1],
vertex_fill_color=col,
vertex_size=g.vp.size,
vertex_text=g.vp.label,
vertex_text_position=4,
vertex_font_size=vf_size,
vertex_font_family="sans-serif"
)
win.add(win.graph)
def update_state():
# Some logic to filter the graph, keep the nodes
# that are active at specific milestones
# and call pixbuf.savev
global count
v_list = nodes_in_years[count] # maintains the nodes of that year
for v in v_list:
active[v] = True
for e in list(v.out_edges()):
e_active[e] = True
g.set_vertex_filter(active)
g.set_edge_filter(e_active)
for v in g.vertices():
g.vp.size[v] = v.in_degree()*0.9 + 1 # This has a dynamic effect of the node sizes
vf_size[v] = v.in_degree()/2.0 # changes the font size
win.graph.regenerate_surface()
win.graph.queue_draw()
# if doing an offscreen animation, dump frame to disk
if offscreen:
pixbuf = win.get_pixbuf()
pixbuf.savev(r'./frames/graph%04d.png' % count, 'png', [], [])
if count > years[-1]:
sys.exit(0)
count += 1
# We need to return True so that the main loop will call this function more
# than once.
return True
Thank you
Yannis
attachment.html (5.63 KB)